I was having a beer with an alumni from my undergraduate school. I haven’t been back there in years, but there is something immutable about the kind of thinkers that Bard graduates. It was a pleasant conversation.
Now I tell Chinese students learning English with us at Soufudao all the time, “Don’t assume the person you are talking with knows any of the same acronyms that you do!”
But then, in this conversation with a fellow alumnus, I found myself tossing around this one acronym in almost every topic we discussed. The PE of this. The PE of that. It’s like PE. Blah blah. Somehow it just kept coming up. And it’s definitely not like I always say these two letters one after another. I’m about to teach my finance course this semester at ECNU. That’s probably why. But I was using it a lot. Too much.
Finally – and this is what always happens, right? – You say an acronym a bunch of times. You had thought that surely your companion knew what you were talking about. And then your conversation partner at some point is forced to ask, “So, um, what exactly is PE now? I don’t know…”
And you think… Right! Yeah, you have had no idea what I’ve been talking about… this… whole… time.
Of course. It’s always like that. No acronym is immune. With my luck, I’d mention USA in a conversation with the one person in the world who didn’t know what the hell that was.
But it bears mentioning. In fact, we should probably repeat this to ourselves over and over again, “Ain’t no shame in asking a dumb question. There’s no such thing as a dumb question.”
There really just is absolutely no shame in asking a dumb question.
There is no such thing as a dumb question.
Right? Got it?
Got it.
There ain’t no shame in asking a dumb question.
There is no such thing as a dumb question.
OK!

Now about this PE…
Growing up, the acronym PE had only one meaning to me. And it had to do with big clocks as jewelry, a guy named Terminator, and another man whose last name was simply D.
The next time I remember thinking about the term I was sitting in a car with my aunt.
“So you like stocks, huh? What is a PE then?”
And although a faint thumping in the back of my head reminded me of the first CD I ever bought (You can listen to it here above. It’s still realllllly good.)… I, like a dumb young college student, replied something like:
“Yeah, it’s how you value stocks. The average now is like 33. But all the good stocks have PE’s WAY higher than that. Because they’re better.”
If you’re already familiar with PE, or the P/E ratio, better known as the price-to-earnings ratio, and sometimes called the P-to-E, you probably realize that this statistic dates me just a little bit. More on that later…
Back in that car ride a long time ago, my aunt tilted her head back. Laughed. And after a while, smiled at me. She asked one simple question.
“Why?”
To which I confidently replied, “This time it’s different.”
You should have seen her smile after that comment. A grin so wide I thought maybe her face was going to separate into two halves and go flying out the window for a merry turn about the mountains where we were vacationing.

The year was 1999 and of course the US stock market was in one of the greatest bubbles the world will ever see. You know the kind it seems to get into every seven to eight years these days…
People were showering millions of dollars on companies who didn’t do much besides have commercials featuring sock puppets. College classmates a year or two older than me were peppered with job offers for $50,000+ a year just for sitting at their desk, watching viral videos, and commenting on them.
Seriously. I was so jealous.
Yeah, this time is different.
Sure.
You see, my aunt knew then what I know now.
It’s never different. History always repeats itself. You may convince yourself that, in fact, history is not repeating itself whenever history happens to you. But always, upon retrospect, you are able to “connect the dots” and see clearly the relationships of all your past actions. Your constantly evolving viewpoint on a particular subject cannot change the immutable aspects of that same subject.
And one of the immutable aspects of the PE ratio is that it should hang out most of the time between 10 and 20. That’s just where stocks spend most of their time.
That number isn’t just pulled out of thin air. It makes intuitive sense. Let me explain.
One of the ways to look at the PE is to think of it as the answer to the question, “How many years will it take for me to earn back my original investment?” Not how long will it take YOU to pay back your initial capital. YOU hopefully have all sorts of income streams you can use to pay it back as quickly as YOU want. The question assumes that you only use the cash generated by the invested asset. If you plowed back every cent of earnings back in to wherever you took the money from to begin with (loan, savings, inheritance, whatever), how many years would it take to earn back that money?
We might also note that when we think of the PE ratio in this way, we are basing this calculation only on current income. The figure does not account for earnings growth in the years after our initial investment.
For example, if I buy a rental house in America, depending on where it is, I could expect to earn back the money that I used to pay for the house (not including interest if it’s a loan, however) in 10 to 20 years. That’s a reasonable investment. After that time period, the asset has essentially “paid for itself” AND you still have the asset! Maybe it’s even gone up a bit in the intervening years. But I shouldn’t count on that price appreciation when I first analyze my potential investment. It is an unknown.
A stock is very similar. For long-term portfolio buys, you should buy assets that are reasonably priced according to conservative estimates. Not newly-built luxury homes at the far edge of town that are priced for perfection. Now you know. (A similar way of thinking about it is the gross income multiplier.) If your realtor is showing you a home that if you rented it out at today’s rental prices for 33 years (that’s longer than the worst-term mortgage!) and still wouldn’t earn back your initial capital… RUN AWAY!
An average P/E of 33 across the whole market is just ridiculous. It has really only happened once – during the Dot Com Bubble that ended in 2001. Technically, we saw that elevated figure at the absolute nadir of the Great Recession, but that was only because companies simply for a brief period just didn’t make any money.
It wasn’t just my aunt that recognized the flawed logic at the time. Economist Robert Shiller wrote a book about it called Irrational Exuberance. Shiller’s argument in that book, along with other works in a stellar career, earned him the Nobel Prize in 2013.
Check out this chart from multpl.com, which tracks the average PE of the S&P 500 from the 1870s to July 28, 2016. I have added red lines at the 10 and 20 marks to illustrate my point.
The Definition of PE
The simple definition of the P/E ratio is a firm’s price per share divided by its annual earnings per share.
But what does that mean?
Now we have to define what price per share (P) is. And we have to define what earnings (E) is.
P is the market price, i.e. whatever the stock is trading at right now.
E is the earnings per share (EPS), a figure which public companies broadcast to the world at the end of every quarter.
Here’s where it starts to get tricky.
The P/E measurement can be made two ways. A trailing P/E uses two verifiable facts: 1) the market price and 2) the trailing twelve-month earnings of the firm. Or we calculate a forward P/E using one verifiable fact (market price) and one rose-colored unicorn guesstimation using the anticipated earnings of the firm in the next twelve months.
Now it may sound reckless to use a guess to make an investment decision. But we have to understand that the market is a forward-looking machine. However, the Wall Street boys can only think about as far ahead as their next bonus. If we take a risk-adjusted truly long-term value-oriented investment strategy, there’s bound to be a few bargains laying about.
The Market PE Today
Where are we now today at the end of July 2017. Well, let me introduce you to a very handy link, where the Wall Street Journal keeps track of the average PEs and dividend yields on six major indexes: Dow Industrial, Dow Transportation, Dow Utility, Russell 2000, Nasdaq 100, and the S&P 500.
Well, I have good news for the bulls. The average PE of the S&P, though slightly elevated compared to historic norms, is actually down from a year ago. The ratio has fallen from 25.03 this time last year to 23.94 today. Looking forward, the data is even more bullish, as Birinyi Associates expects the average S&P PE to fall to 18.94, well below that important threshold of 20.
It pays to know what the PE is.


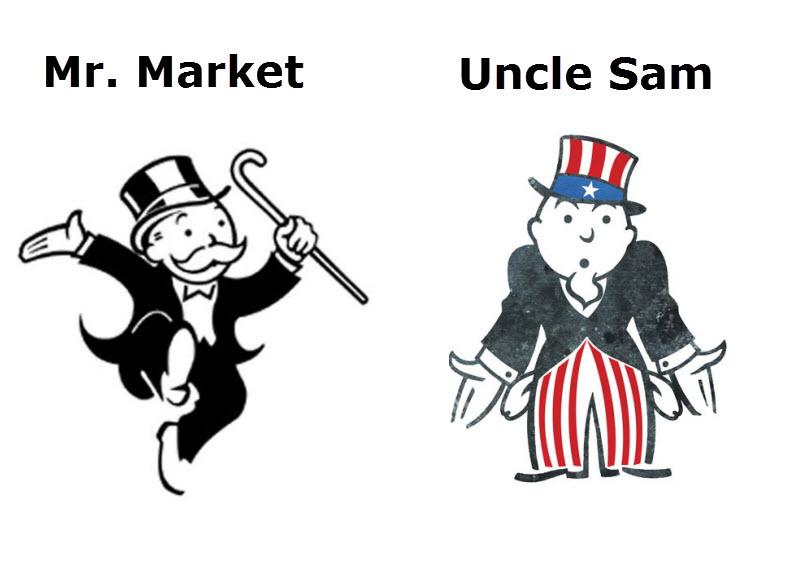
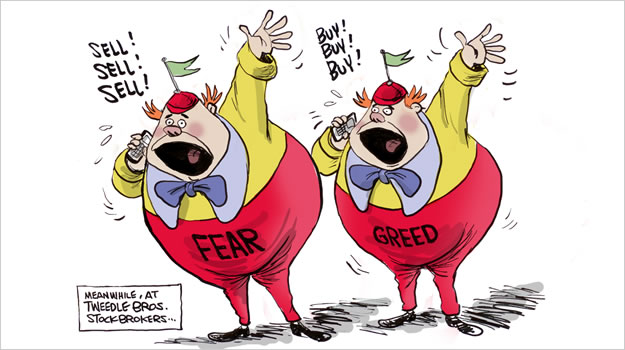
 Prof. Graham asked his class to imagine a “remarkably accommodating” schizophrenic man, Mr. Market. For some reason, you find yourself a business partner of this madman. The guy is just nuts. He paces the halls throughout the day. For no reason at all and at seemingly random times, he just interjects the current prices of a wide range of securities. He doesn’t even take an hour-and-a-half break in the middle of the day like his cousin, Market Xiansheng, does in China. It’s like he’s drunk or something, kicking around the office all day yelling out numbers and pleading with just about anybody in his vicinity to buy or sell those securities he’s screaming about.

